
Part 2: Evaluating Accessibility to Hurricane Evacuation Centers
Defining the Urban Street Network
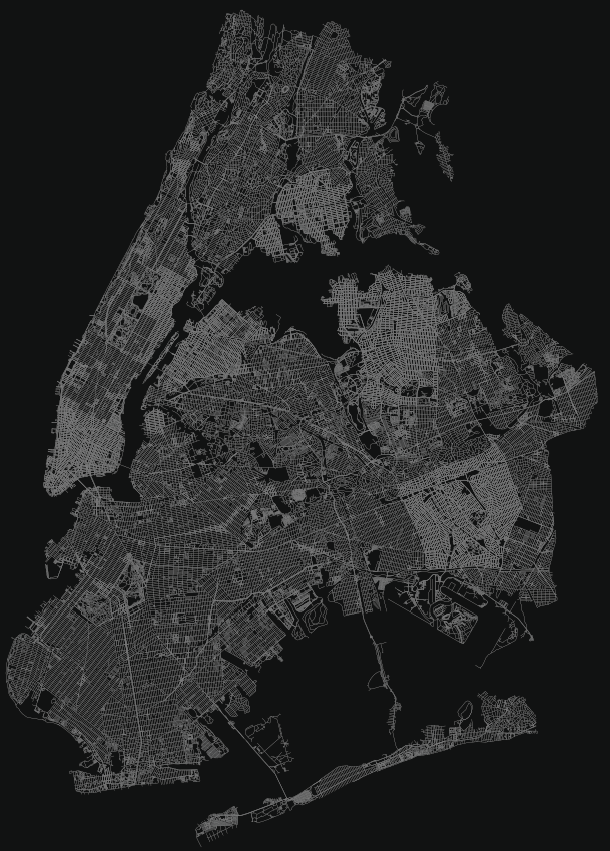
The walkable road network for all of NYC is massive - this image is an export of the output from OSMnx showing all walkable paths.
Investigating Walking Accessibility to Nearest Evacuation Center
This static map to illustrates the distance of each node to the nearest center the map (shown in red). The maximum distance for this network analysis was set to 2000 meters. Every node beyond 2000 meters is color-coded in the same purple hue, indicating relative inaccessibility.
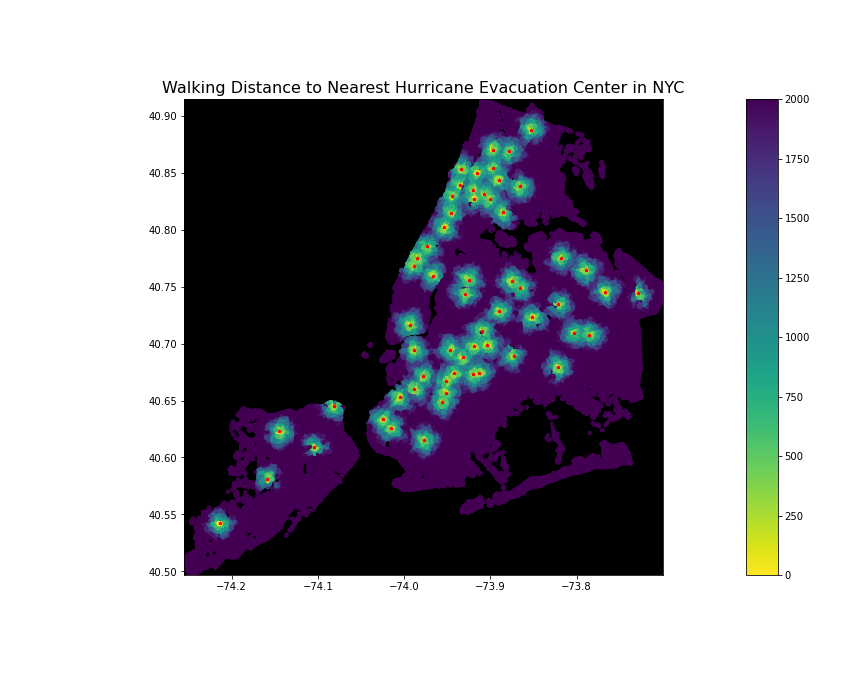
The interactive version of this accessibility surface is below (note: it is slow to load). Hurricane evacuation center points are not shown on this version, but they can be inferred based on the patterns of the colors going from darker to lighter.