Part 1: Exploratory Analysis of Population Density & Social Vulnerability
Total Population & Population Density
To gain a better understanding of where major centers of population are situated throughout the city, I pulled data from the US Census to obtain the total population estimate and land area for each tract. I first grouped population by borough and charted the total population in each. The Bronx has the highest total population.
To get a more normalized measure of population, I calculated a new variable for population density:
Population_Density = Total_Population/AREALAND
To illustrate population density spatially, the interactive map below shows population density by census tract across NYC.
Overall SVI
According to the CDC, “social vulnerability refers to the potential negative effects on communities caused by external stresses on human health. Such stresses include natural or human-caused disasters, or disease outbreaks.” The CDC/ATSDR Social Vulnerability Index (CDC/ATSDR SVI) uses 15 US Census variables to assemble an index score for social vulnerability at different geographic levels.
Since this index is specifically intended for disaster preparation and support for local communities and already incorporates robust census data, I downloaded the tract-level index for New York State and filtered to NYC.
SVI Themes
In addition to an overall SVI score, the dataset also contains the individual scores for four different social vulnerability themes. I mapped the four themes’ scores across each census tract. Higher scores indicate higher vulnerability for each theme. Below each map is a box and whiskers plot showing the distribution of scores per theme across all census tracts by each of the five boroughs.
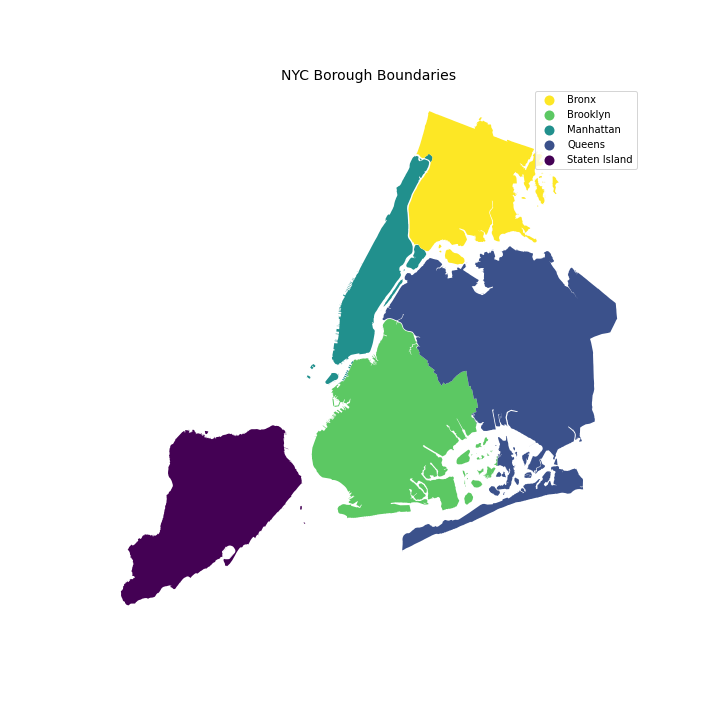
For reference, here is a map of the five boroughs.
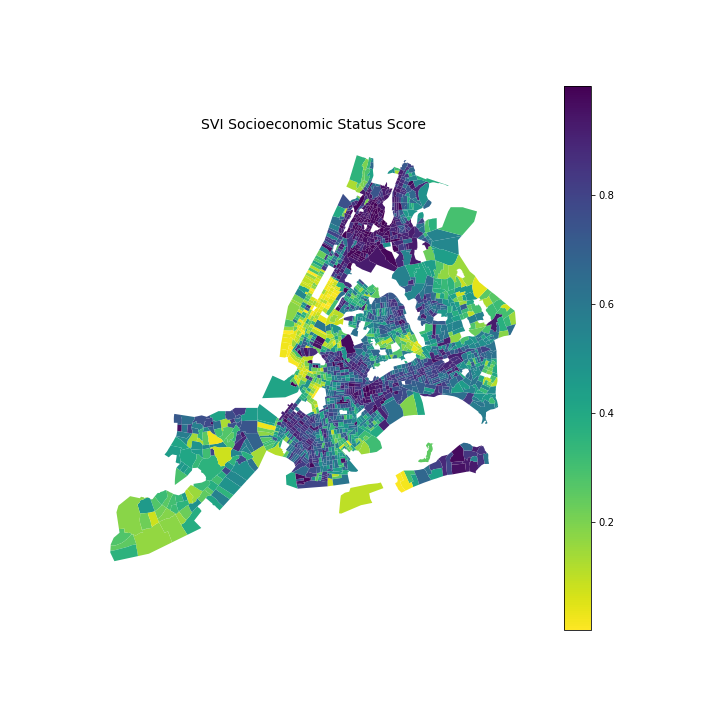
Theme 1: Socioeconomic Status
The socioeconomic status theme incorporates data on individuals below poverty, unemployment, low income levels, and educational attainment (no high school diploma). As shown in this map and accompanying plot, the Bronx contains census tracts with higher values for this category, indicating greater concentration of socioeconomic vulnerability compared to areas like Staten Island (lower left of the map). Pockets of Manhattan also appear to have higher scores.
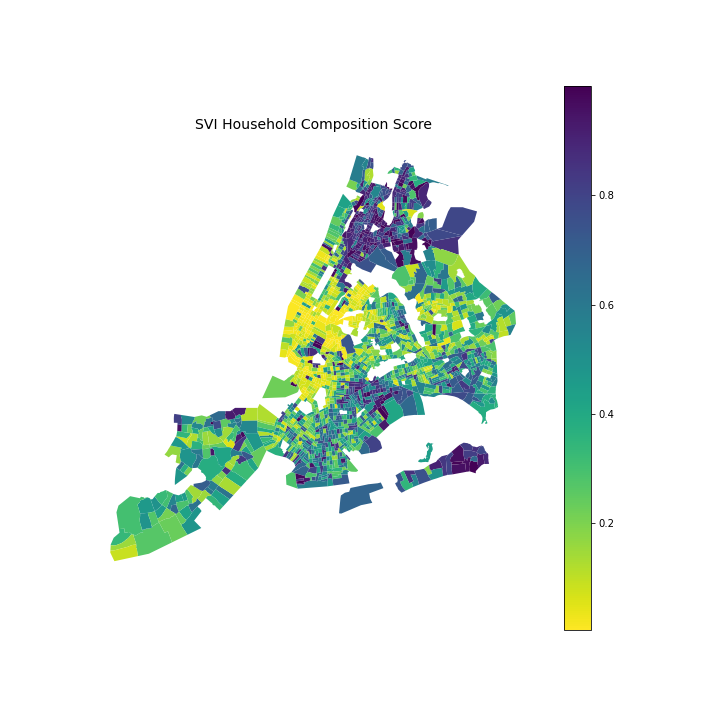
Theme 2: Household Composition & Disability
The household composition & disability theme factors in the number of individuals who are aged 65 or older, aged 17 or younger, and older than age 5 with a disability. The score also accounts for single-parent households. Similar to the first theme, the darker shaded census tracts in the Bronx indicate higher vulnerability for this theme. However, unlike in the first theme, the range of higher vulnerability scores for this theme is lower for Manhattan - which is especially evident when looking at the box and whisker plot showing a median score of 0.15 for Manhattan.
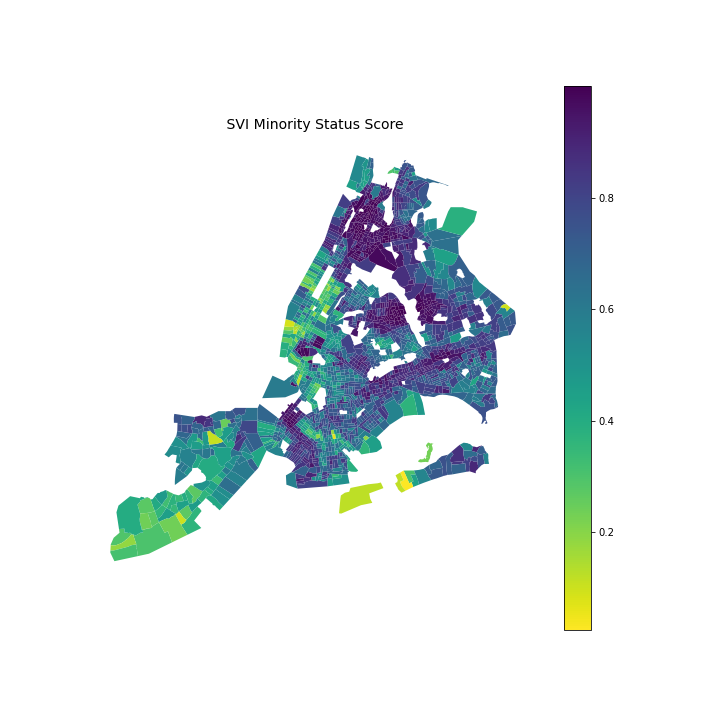
Theme 3: Minority Status & Language
The minority status & language theme encompasses individuals of a minority status and those who speak English “less than well”. Higher scores for this theme appear evident across the city, which is consistent with general knowledge of NYC being a city with a large immigrant population and the presence of ethnic enclaves.
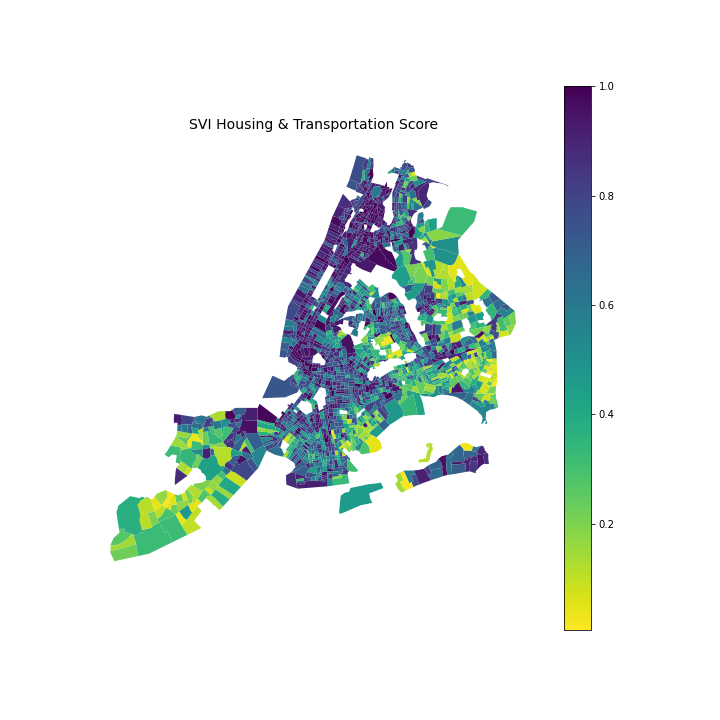
Theme 4: Housing Type & Transportation
The housing type and transportation theme covers data on multi-unit structures, mobile homes, crowding, lack of vehicle access, and group living quarters. Manhattan has the highest median score for this theme (0.87), which is expected given the higher population density.